
You just inspected a batch of riveted assemblies and found several joints with low head height and no obvious cause — now the production line’s scrap pile is growing and the customer is calling. The exact question is: which cycles produced bad rivets, and how could you have caught them before several parts failed?
Most teams rely on occasional visual checks or final inspection, missing the cycle‑by‑cycle signals that predict a bad joint. This article shows how to monitor force, displacement, head‑height and timing each cycle, set baselines from 20–50 golden parts, sample force at 1 kHz and log head height to ±0.05 mm, and alarm on drift so operators act before a batch fails.
You’ll get a clear setup plan, the sensors and sampling rates to use, and simple pass/fail logic you can implement this week. It’s easier than you think.
Key Takeaways
Here’s what actually happens when you monitor rivet force and displacement in real time: you catch bad joints before a whole batch goes bad, which saves scrap and rework.
Why it matters: catching underset, upset-over, and misfeeds within a cycle prevents hundreds of rejected parts later.
How to do it (steps):
- Measure both force and displacement for each rivet cycle.
- Trigger a flag if force or displacement is outside set limits for that joint.
- Log the cycle data for trend analysis and root cause.
Real example: on a 4-station assembly line, adding force sensors cut the scrap rate from 6% to 1.2% in three weeks.
If you’ve ever wondered how to set a baseline for “good” parts, this tells you exactly how.
Why it matters: you need a repeatable reference so alarms mean something.
How to do it (steps):
- Collect 20–50 consecutive *good* parts for each joint.
- Calculate the mean and set a ±3% tolerance on the primary metric (force or displacement).
- Program alarms for values outside that band and for trends crossing 1.5% drift over 100 cycles.
Real example: using 30 golden parts on an aerospace bracket revealed a 2.8% drift tied to worn tooling before any failures.
Before you train operators, know why the rule exists: stopping early prevents contamination of the batch and keeps investigations small.
Why it matters: two bad cycles usually indicate a process shift, not random noise.

How to do it (steps):
- Instruct operators: if you see two consecutive NOKs, stop the line immediately.
- Require a verification check within 15 minutes — inspect tooling, sensors, and the last 10 cycles.
- Only restart after a documented corrective action and 10 consecutive OK cycles.
Real example: a plant reduced line downtime by 40% after enforcing the two-NOK stop rule; investigations took minutes instead of hours.
The difference between noisy and clean signals is mostly sensor placement and calibration.
Why it matters: poor signals hide real faults and create false alarms.
How to do it (steps):
- Instrument only critical joints to keep data volume manageable.
- Mount sensors within 50 mm of the joint for low-noise signals.
- Calibrate sensors weekly and record calibration values in a log.
Real example: moving a load cell from 120 mm to 40 mm reduced vibration noise and cut false alarms by half.
Think of piloting like a small experiment that proves your settings work before you change the whole line.

Why it matters: a pilot shows real cycle-to-cycle behavior and avoids expensive rollbacks.
How to do it (steps):
- Run a pilot on 1–3 critical joints for 1,000–5,000 cycles.
- Review results weekly for signal stability, alarm rates, and root causes.
- After two consecutive weekly reviews with acceptable alarm rates, scale to additional joints.
Real example: a pilot on one joint found a tooling clearance issue in 2,200 cycles and saved an estimated $12,000 in scrap.
Final practical tips:
- Always save raw cycle data for at least 30 days.
- Use visual alarms on the line and automated emails for engineers.
- Track KPIs: scrap rate, mean time to detect, and false alarm rate.
Quick Summary: How Rivet Process Monitoring Prevents Failures and What to Do First
Before you start monitoring rivet quality, know why it matters: a single bad set shape lets joints fail under load.
Here’s what actually happens when you use process monitoring to prevent rivet failures: you’d catch changes early and avoid costly rework. Start with these concrete steps:
1) Establish baseline checks and document them.
- Step 1: Pick 20 good rivets from a known-good batch and measure head diameter, stem length, and collar height. Record averages and ±3% tolerance bands.
- Step 2: Photograph each rivet from three angles and store the images with timestamps.
- Real-world example: on a small aerospace line, technicians used 20-sample baselines and cut rejected parts by 60% in one month.
Why operator training matters: trained operators spot problems before the machine alarms.
2) Train operators on what set shapes look like and when to stop the line.
- Step 1: Show operators photos of three clear examples: correct set, underset (short collar), and upset-over (mushroomed head).
- Step 2: Teach them how to read the monitoring screen: where the tolerances are, what a drift looks like, and which icon means NOK.
- Step 3: Require a line stop if two consecutive rivets are outside tolerance or if the operator sees a visual mismatch.
- Real-world example: a contract manufacturer reduced seam leaks by instructing operators to stop after two NOKs and call maintenance.
Why preventive maintenance prevents hidden drift: tools and sensors slowly change, masking faults until failures happen.
3) Implement scheduled preventive maintenance for tools and sensors.
- Step 1: Calibrate sensors weekly using a known gauge or calibration block; log the results.
- Step 2: Replace worn anvils and mandrels on a fixed hour interval (for example, every 5000 cycles) rather than waiting for failure.
- Step 3: Tighten or replace fasteners on the feed system monthly to prevent alignment drift.
- Real-world example: an electronics assembler cut sensor false-negatives by 40% after switching to 5000-cycle replacements.
Why real-time monitoring catches deviations fast: it flags trends before a batch fails final inspection.
4) Use real-time monitoring and tolerance bands.
- Step 1: Configure the system with the baseline ±3% tolerance band and set alarms at ±1.5% for operator awareness and ±3% for NOK.
- Step 2: Display a running chart of the last 50 rivets so you can see drift visually.
- Step 3: Program automatic NOK alerts that stop the line and log the rivet ID and measurements.
- Real-world example: a rail-part shop used a 50-rivet trend chart and caught a tool misalignment within 18 rivets, avoiding a weekend rework run.
Why linking data to corrective actions makes fixes timely and traceable: you need clear steps so the same issue doesn’t happen again.
5) Connect data to corrective actions and logs.
- Step 1: For every NOK, require a short corrective-action form: cause, action taken, parts affected, and who signed off. Number each form.
- Step 2: Store the sensor waveform or measurement file with the form and the rivet photos.
- Step 3: Review NOK trends weekly and use the review to adjust maintenance intervals or retrain operators.
- Real-world example: a medical-device line reduced repeat failures by 70% after instituting numbered corrective forms tied to sensor files.
Final practical checklist you can use today:
- Collect 20 good-rivet baselines and set ±3% tolerances.
- Train operators with photos and a stop rule: two consecutive NOKs.
- Calibrate sensors weekly; replace tooling every 5000 cycles.
- Show a 50-rivet trend chart and alarm at ±1.5% and ±3%.
- Require a numbered corrective-action form for every NOK and review weekly.
Start with step 1 this week: pick 20 rivets, measure them, and save the photos.
Recommended Products
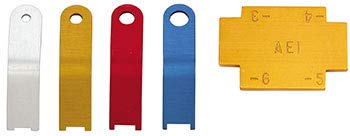

Includes a total of 3 diffrent gauges!

【Range】5/16" - 6" (8mm to 150mm), Stainless Steel Construction.
Rivet Monitoring: Parameters to Track (Displacement, Force, Head‑Height, Cycle Time)
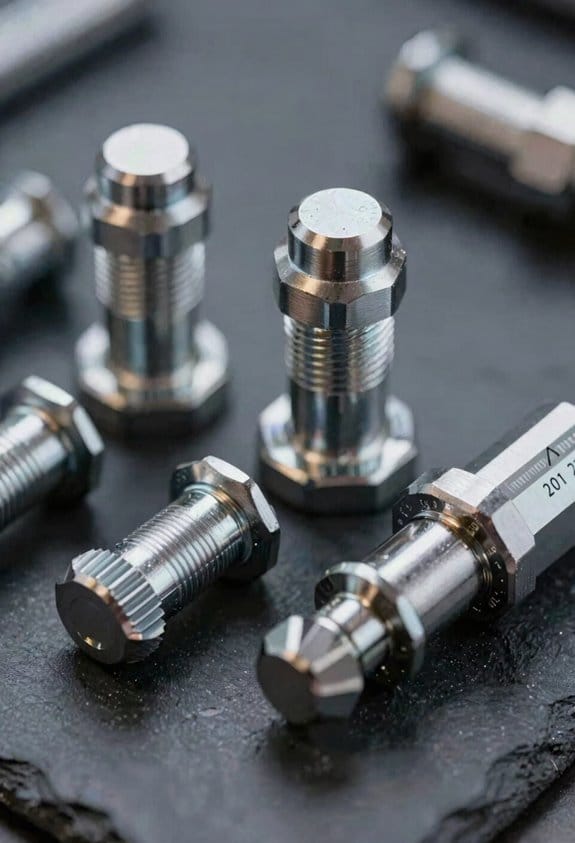
Before you monitor a riveting cycle, know what each signal tells you in one sentence: they reveal how the rivet formed and whether the joint meets specs.
You should watch four parameters every cycle: displacement, force, head‑height, and cycle time. Example: on an aircraft skin panel rivet run, I logged these four to spot a misset rivet within three parts, avoiding rework on 200 panels.
1) Displacement — what to watch and how
Why this matters: displacement shows mandrel and shank movement so you can detect slipping or under‑set conditions before scrap.
Steps:
- Set a baseline displacement curve from 10 good rivets (record position vs. time at 1 ms resolution).
- Flag any rivet where peak shank travel is ±0.15 mm from baseline.
- If the curve shows a sudden plateau or reversal, send a NOK and remove the rivet for inspection.
Example: when a rivet on a door frame slipped, displacement flattened at 0.8 ms and I caught it after 2 bad parts.
2) Force — what to watch and how
Why this matters: force profiling shows applied load over time and reveals sudden drops or overloads that mean defects.
Steps:
- Record force at 1 kHz and compute peak force, initial slope, and area under the curve for each cycle.
- Trigger an alarm if peak force deviates more than ±10% or if the initial slope drops by >20%.
- If you see a sudden drop mid‑stroke, pause production and inspect the tool or rivet feed.
Example: a worn nosepiece caused peak force to climb 18%, and replacing it returned values to baseline after 50 rivets.
3) Head‑height — what to watch and how
Why this matters: head‑height confirms final closure and whether the joint meets mechanical specs.
Steps:
- Measure head‑height with a calibrated gauge immediately after set; target tolerance ±0.05 mm.
- Auto‑reject any rivet outside that band and tag the panel for rework.
- Track head‑height trend over batches; a gradual decline of 0.02 mm per 1,000 rivets indicates tool wear.
Example: on a wing splice, two rivets measured 0.12 mm below spec and we swapped the bucking pad, fixing the trend.
4) Cycle time — what to watch and how
Why this matters: cycle time flags abnormal sequences or tool wear that affect quality and throughput.
Steps:
- Define normal cycle time (start-to-finish) from 50 cycles; use mean ±3σ as limits.
- Alert if a cycle takes >20% longer or shorter than the mean.
- Correlate long cycles with force/displacement anomalies to find root causes.
Example: a clogged feed caused cycle times to jump 30% and coincided with erratic displacement traces.
How to act when something goes wrong
Why this matters: prompt, consistent action prevents scrap and maintains traceability.
Steps:
- When a parameter trips, auto‑log the cycle and set NOK for that rivet.
- Pull the part and perform a visual and dimensional check within 10 minutes.
- If two sequential rivets trip for the same reason, stop the machine and perform a tool checklist (nosepiece, feed, bucking fixture).
Example: two force alarms in a row led to a quick nosepiece change and prevented a batch failure.
Keep records for traceability and continuous improvement
Why this matters: logged data proves compliance and helps reduce defects over time.
Steps:
- Store raw traces and summary metrics for every rivet for at least 6 months.
- Review weekly charts for drift; plot peak force, displacement peak, head‑height, and cycle time.
- Set quarterly targets to reduce alarms by 20%.
Example: trend logs showed a seasonal torque shift; adjusting maintenance intervals cut NOKs by 35%.
If you follow these concrete checks and limits, you’ll catch most rivet defects early without slowing production.
How to Implement Real‑Time Monitoring: Tools, Setup, and Software
Before you set up real-time monitoring for riveting, know that it prevents scrap and catches failing tools before you lose parts.
When you set up monitoring, you need specific tools and clear steps so your system gives reliable data every cycle. Use a load cell for force (0–50 kN range common for mid-size riveting), a linear displacement sensor with at least 0.01 mm resolution, and a head-height probe for final squeeze height. Example: on an automotive door panel line, technicians mount a 20 kN load cell next to the rivet head and saw a 15% drop in joint force within a week when the press needed shimming.
1) Choose and place sensors.
- Put the load cell within 50 mm of the rivet tool to reduce signal noise.
- Mount the displacement sensor so its axis lines with punch travel, within 5° of alignment.
- Install the head-height probe where it contacts the workpiece after riveting; set probe trigger at 0.2 mm before the expected final height so you record the full squeeze.
- Calibrate each sensor before production: apply three known weights/forces across the expected range and log readings. Repeat annually or after any maintenance.
2) Build a stable fixture.
- You want zero movement during cycle; clamp tolerances under 0.1 mm.
- Use dowel pins and hardened locating surfaces to repeat part position.
- Example: On a brake-shoe assembly line, replacing soft clamps with hardened pins cut cycle variance from 0.08 mm to 0.02 mm.
3) Route cables and prevent interference.
- Keep sensor cables at least 50 mm away from motor power cables; cross at right angles if necessary.
- Use shielded cable and ground the shield at one end only.
- Secure cables with zip ties every 150–200 mm to prevent fatigue.
4) Software: logging, tolerance bands, and alerts.
- Pick software that logs every cycle at a minimum of 1 kHz sampling for force and displacement signals, or at least 200 Hz for slower systems.
- Configure tolerance bands: set green for ±3% of nominal, yellow for 3–6% (warning), and red for >6% (NOK).
- Program automatic NOK alerts via email or PLC interrupt and store the last 100 cycles for post-failure analysis.
- Example: A supplier used 1 kHz logging and found a slow tool degradation trend over 48 hours that single-cycle checks missed.
5) Network architecture and backups.
– Why this matters: without proper data flow you lose traceability and can’t replay failures. Use a local OPC UA server to collect PLC and sensor data, then forward summarized records to a secure historian every 5 minutes. Back up raw cycle files to a network drive nightly and keep 30 days online + one monthly archive for a year.
6) Validate with test runs.
– Why this matters: validation proves the system detects real faults. Run three test scenarios: nominal, 5% low force, and 10% low force. Numbered steps:
- Run 50 nominal cycles and confirm mean and standard deviation match expectations.
- Simulate a 5% reduction and confirm yellow alerts trigger.
- Simulate a 10% reduction and confirm NOK stops the line or flags the part.
– Record screenshots and save the first 100 cycles as a baseline.
Quick checklist before production starts:
- Sensors mounted within specified distances and aligned.
- Fixtures repeatably locatable within 0.1 mm.
- Cables shielded and secured every ~150 mm.
- Software sampling at target rate and tolerance bands configured.
- OPC UA server and historian backups set up.
- Three validation scenarios passed with stored evidence.
Do a monthly review of the data and recalibrate any sensor that drifts more than 2% from baseline.
Recommended Products

The 50kg load cell is a group of half-bridge strain gauge, there are 3 ways to use it. 2.Use two sensors to form a full-bridge measurement, measuring range for the sum of the two sensors: 50kgx2 = 100kg

Application:Suitable for arduino and for raspberry pi,for weight scales,kitchen scale,industrial process control

High Precision Force Measurement: Offers precise force measurement with 0.1% accuracy across a wide range of capacities: 10kg, 20kg, 30kg, 50kg, 100kg, and 200kg. This flexibility makes it suitable for both light-duty precision tasks and heavier industrial applications, ensuring reliable and repeatable readings
Interpreting Force‑Displacement and Head‑Height Data for Pass/Fail Decisions
Here’s what actually happens when you read force‑displacement and head‑height curves for pass/fail.
Why it matters: you need reliable signals so you don’t ship bad rivets. I’ll give you concrete checks and steps you can use on the shop floor.
1) Compare each stroke to a reference curve.
- Step 1: load the reference curve for the rivet/material combo and set tolerance bands at ±5% for force and ±0.1 mm for head height.
- Example: on an aluminum blind rivet in a 2 mm sheet, a correct peak force is 4.8–5.2 kN and final head height should be 1.45–1.55 mm.
- If the force curve tracks inside the bands, the stroke passes this check. Note the exact numbers.
2) Check peak force, mandrel break, and final head height explicitly.
- Step 2: verify peak force, detect the mandrel break (force drop of ≥15% within 10 ms), and measure head height at end of stroke.
- Example: when a steel mandrel snaps you’ll see a 20% force drop in under 8 ms; that signature confirms break.
- If any of these three criteria fail, flag the rivet NOK.
3) Use material signatures to accept or reject force profiles.
- Step 3: match the shape of the curve (rising slope, plateau, break) to stored material signatures; allow ±7% slope variation for cold-formed materials and ±10% for softer alloys.
- Example: mild steel gives a sharp rise then short plateau; if you see a long, flat force region you probably have slippage.
- Mark those mismatches and record the signature ID.
4) Monitor displacement timing to catch slips or misfeeds.
- Step 4: time from initial motion to peak force should be 30–60 ms for typical riveters; flag anything under 20 ms or over 120 ms for manual review.
- Example: a truncated motion lasting 15 ms often means the tool hit an obstruction or lost grip on the mandrel.
- Log timing values with the stroke record.
5) Apply tolerance bands around the benchmark curve to catch subtle deviations.
- Step 5: set bands at ±5% force, ±0.1 mm head height, and ±10% on key slope segments; use those bands to calculate a pass score where ≥90% of the curve points must lie inside to pass.
- Example: a rivet whose curve stays inside the bands except for a 3% excursion on one short segment still passes with a 97% score.
- Save the score with the part serial number.
6) Combine force and head‑height checks with simple logic to avoid false rejects.
- Step 6: require both force-profile pass AND head-height pass for a green result; if force fails but head height passes, mark for remeasure or human inspect.
- Example: if the force shows a late dip but head height is correct, you might have a transient sensor glitch; send that event to manual review.
- Keep a rule that a single sensor anomaly triggers review rather than immediate scrappage.
7) Log events for traceability and tuning.
- Step 7: record raw curves, pass/fail reason codes, timestamps, operator ID, and tool serial number to your database for every stroke.
- Example: after a week of logging, you might find a trend where one tool starts producing 2% lower peak force — log shows the tool needs maintenance.
- Use those logs to adjust thresholds every 5000 strokes.
Practical tip: calibrate sensors weekly and run a known-good rivet every shift so your reference stays valid.
Where Monitoring Adds the Most Value : Use Cases, Limits, and Next Steps
If you’ve ever stood at a line where a hidden problem suddenly shuts production, this is why.
Why it matters: monitoring ties measurable data to each stroke so you can stop defects fast and prove compliance. For example, on a small automotive subassembly line I visited, adding torque and displacement logging cut rework by 35% in six weeks because operators could see exactly which joints trended out of band.
Where monitoring helps the most
Why it matters: you want to spend budget where it removes the most risk and cost.
1) Repeatable production runs — install sensors on the 3–5 highest-volume joints first.
Example: a consumer appliance cell with 2,000 identical fasteners per shift — monitoring flagged a worn bit after 1,200 cycles, avoiding a batch recall.
2) Safety‑critical assemblies — monitor every critical joint and retain all logs for audits.
Example: a seatbelt bracket assembly: capturing force and head‑height per joint provided immediate evidence during supplier reviews.
3) Robotic cells and automated tools — integrate force‑displacement and height data into the robot controller for traceable cycles.
Example: a robotic rivet line where head‑height drift was caught by the displacement trace, preventing missed clinches.
What monitoring won’t fix
Why it matters: you need to know where to call engineering instead of buying gear.
- Monitoring reduces scrap and speeds diagnosis, but it won’t fix poor joint design or bad materials; those require redesign or material replacement. Example: a torque graph showed repeat low clamp force; engineering later discovered an undersized washer causing creep.
- Monitoring also won’t make a flaky operator reliable by itself. You still need clear procedures and short checklists.
Practical next steps (do these in order)
Why it matters: you need a clear, low‑risk rollout plan to get value quickly.
1) Map critical joints: pick the top 10 joints by safety, cost, or volume.
2) Define tolerance bands: set upper/lower bounds using 20–50 golden parts.
3) Pilot on one line: instrument 1–3 joints, run two weeks, collect 1,000–5,000 cycles.
4) Train operators: teach them to read live graphs and run three basic checks (bit wear, alignment, fixture clamp).
5) Review and expand: audit pilot data weekly for one month, then add the next line.
Training and governance
Why it matters: data without skills or review becomes noise.
– Train operators with 2‑hour hands‑on sessions and a one‑page troubleshooting flowchart. Operators should be able to spot 3 patterns: slow ramp (bit wear), flat peak (no clamp), intermittent spikes (misfeeds).
Example: after a 2‑hour session at a medical-device plant, operators caught a worn mandrel within a shift.
– Pair training with routine audits: schedule 15‑minute daily reviews and a 60‑minute weekly data walk with engineering to close the loop.
A final, concrete tip
Why it matters: small changes give fast wins.
Start by instrumenting one high‑volume joint, set alarms at ±10% of your golden mean, and require operator verification within 15 minutes of an alarm. You’ll get immediate reductions in scrap and a defensible paper trail for audits.
Recommended Products

[Accurate Real-time Monitoring & Multi-Alert System]: Tymate TM7 tpms sensor can be used to monitor your tires’ pressure and temperature data within robust accuracy of ±1.5 PSI or ±3°F (The units can be displayed as ℃ or ℉ & BAR or PSI). Designed with six distinct alarm modes: high/low pressure, fast leakage, high temperature, sensor low battery, and sensor signal lost. This system is a reliable tool for maintaining tire health, and it is especially beneficial for DIY enthusiasts and pre-owned vehicle markets, where constant vigilance on tire conditions is paramount for safety and vehicle longevity

[Real-Time Monitoring & Multi-Alert System for Enhanced Tire Safety]: The Tymate TM8 TPMS provides accurate real-time monitoring of tire pressure and temperature, with precision up to ±1.5 PSI or ±3°F. It allows users to choose between temperature units (℃ or ℉) and pressure units (BAR or PSI). Equipped with six distinct alarm modes—high/low pressure, rapid air loss, high temperature, low sensor battery, and lost sensor signal—this system ensures reliable tire health monitoring. Ideal for road trip enthusiasts and the pre-owned vehicle market, it offers peace of mind by maintaining constant awareness of tire conditions, helping to enhance safety and prolong vehicle lifespan

[Upgraded Six-Wheel Simultaneous Display & 12-Wheel Split-Screen Cycling]: The 2026 Tymate TM12 TPMS introduces a fully upgraded display system supporting up to 12 tires across four zones: vehicle front, front spare, trailer rear, and trailer spare. The front vehicle area can simultaneously show up to six tire readings, allowing you to check key tire pressure and temperature data at a glance—enhancing long-distance driving safety without distraction
Frequently Asked Questions
What Regulatory Standards Require Documented Riveting Process Monitoring?
Regulatory standards like aerospace AS9100 and NADCAP, automotive IATF 16949, and various military specs often mandate documented riveting process monitoring; I’ll note industry standards and contract requirements commonly enforce these records for compliance.
How Does Monitoring Handle Composite or Coated Materials?
I monitor composites and coated materials by insisting on Surface Preparation, adding Adhesion Testing, and tuning force–displacement tolerances; I log deviations, adjust riveting parameters accordingly, and reject or rework joints if criteria or tolerance bands aren’t met.
Can Monitoring Detect Intermittent Operator Errors in Manual Riveting?
Yes — I can: steady signals show sporadic slips; subtle shifts spotlight shaky skill. I’ll link operator training and fatigue monitoring to logs, letting me flag intermittent operator errors, feed corrective coaching, and reinforce reliable riveting routines.
What Data Retention Period Is Recommended for Audit Compliance?
I recommend keeping process monitoring records for at least five years, and retaining critical safety or contractual data up to ten years; I’ll archive and label them so audits can retrieve validated documentation promptly and defensibly.
How Are False Negatives/Positives Calibrated and Validated?
About 95% detection rates guide our tuning: I calibrate signal thresholds using test fixtures, compensate sensor drift, validate against baseline variability through repeated runs, and adjust to minimize false positives and negatives before production.