
You stared at a production batch where joint variation kept failing inspection despite operators following the same setup, and you wondered why manual rivet installs still produce scrap.
You can point to inconsistent hand force or misaligned inserts, but the exact question is: how do you get repeatable rivet joints without blowing budget or halting the line?
Most teams assume simply buying a cheaper automation unit or training operators more will solve it.
This article shows you how to pick the right machine class for your material and peak forming force, how sensor fusion (force, position, vision) prevents defects in real time, and how to plan commissioning and spares so downtime stays minimal.
You’ll get step-by-step selection and integration actions that reduce defects and prove ROI.
It’s simpler than you think.
Key Takeaways
Here’s what actually happens when you automate rivet installation: you get steady quality and measurable data that cut scrap and rework. For example, an aerospace shop that switched to automation dropped rework by 35% within three months, and you can see that on the machine’s log.

Robotic and servo-driven riveters keep force and placement within tight limits, so your bucktails form uniformly every cycle. A specific case: a sheet-metal shop using a servo riveter held insertion force to ±5% and reduced rivet misalignment from 2% to 0.2% across 10,000 joints. That consistency saves you time on inspection.
Before you invest, know that integrated sensors and vision let you verify joints in real time and export force/position data for analytics. One avionics manufacturer streams this data into its dashboard and flags any rivet with force outside a 3 kN–3.3 kN window, so operators can pull suspect parts immediately.
Why faster cycles and better ergonomics matter: they raise throughput and cut labor costs, shortening how fast you’ll see ROI. A manufacturer reported cycle times falling from 12 seconds to 6 seconds per rivet, halving rivet-station labor and recouping the robot cost in under two years.
If you want to control lifetime costs, follow a structured plan for commissioning, maintenance, and ROI modeling so you can calculate cost per rivet and reduce failures. Use these steps:
- Measure current cycle time, scrap rate, and labor cost per rivet. (Example: 12 s, 4% scrap, $0.20 labor.)
- Set target metrics for automated cells (e.g., 6 s, ≤0.5% scrap, $0.05 labor).
- Build a maintenance schedule: weekly sensor checks, monthly calibration, annual actuator rebuild.
- Model ROI with conservative gains: assume 50% cycle time reduction and 2% scrap rate until proven otherwise.
- Track field failures and tie each to a corrective action in your CMMS.
A maintenance shop that followed those steps cut its total cost per rivet from $0.45 to $0.18 within 18 months, and reduced failure incidents due to missed calibration by 80%.
Why Automation Matters for Rivet Installation Today (Engineers & Procurement)
If you’ve ever watched a technician set dozens of rivets by hand, this is why automation matters now.
Why it matters (one sentence): Automation gives you consistent joint quality and reliable data so you can hit tolerances and cut downtime. Example: on an aircraft wing panel line, a pneumatic rivet machine reduced rework from 4% to 0.5% within two months, saving hundreds of labor hours.

How automation improves joint quality
Why it matters (one sentence): Machines control force and placement far better than hands do, so your scrap and rework drop. Example: a servo-driven riveter applies 1.2 kN of squeeze with ±0.05 kN repeatability, producing visibly uniform bucktails across 1,000 rivets.
Steps to validate quality once you automate:
- Calibrate the tool to the specified squeeze force and stroke length. Do this weekly.
- Record batch-level torque/force data and store for 90 days.
- Sample inspect 1% of assemblies per shift with a pull test.
Takeaway: log files let you trace any joint back to a machine and a batch.
How automation helps your engineers
Why it matters (one sentence): Repeatable data lets engineers prove designs meet tolerances and tune joint specs faster. Example: using cycle-by-cycle force logs, an engineer trimmed clearance from 0.5 mm to 0.3 mm and stopped a vibration issue on a delivery vehicle.
Practical steps engineers should take:
- Specify the measurement data you need (force, stroke, position) — at least 100 Hz sampling.
- Require exportable CSV or OPC-UA output.
- Run a design-of-experiments (DOE) with 3 rivet sizes and 5 force levels to map sensitivity.

Takeaway: insist on data, not just a pass/fail light.
How automation helps procurement
Why it matters (one sentence): Shared performance metrics align purchases with cycle time and maintenance needs so you don’t buy the wrong unit. Example: procurement bought a 30 cycles/min head for a supplier line, but engineers needed 60 cycles/min; returning the unit cost months and added shipping fees.
What procurement should specify:
- Cycle rate (e.g., 60 rivets/min sustained).
- MTBF and recommended spares (ask for 2 spares of wear parts per 10,000 rivets).
- Service-level agreement: 48-hour on-site support or loaner unit.
Takeaway: tie purchase orders to measurable specs and penalties.
How automation speeds assembly and reduces risk
Why it matters (one sentence): Faster, repeatable machines raise throughput and cut ergonomic injuries from repetitive hammering. Example: an automotive supplier raised line speed 20% and reduced wrist strain claims by 70% after switching to robotic riveting.
Steps to plan line integration:
- Measure current takt time and set target rivets/min.
- Choose a cell with integrated part fixturing and quick-change tooling.
- Train 2 operators per shift for first-line maintenance.
Takeaway: plan for tooling changeover in under 15 minutes.
How to evaluate total cost of ownership
Why it matters (one sentence): Purchase price hides cycle times, spare parts, and downtime costs that affect your real spend. Example: a cheaper riveter saved 30% upfront but required monthly rebuilds, tripling lifetime maintenance costs.
Cost checklist:
- Upfront cost.
- Consumables per 10,000 rivets.
- Expected downtime per year and cost/hour.
- Training and integration labor hours.
Takeaway: calculate cost per rivet over expected life.
How to set specs for integration and support
Why it matters (one sentence): Clear specs remove ambiguity and speed commissioning. Example: a buyer required OPC-UA and a 4-week commissioning window; the system was live on day 18 because the vendor preconfigured the interface.
Minimum tech spec template:
- Electrical and air requirements (e.g., 230 V, 16 A; 6 bar dry air).
- Data output (OPC-UA and CSV).
- Physical footprint and tool-change time.
- Warranty and spare-part lead times.
Takeaway: put these in the contract.
Final practical tip
Why it matters (one sentence): You’ll get better results if you treat automation as a joint engineering–procurement project with clear metrics. Example: set a KPI of rivets/hour, scrap rate, and mean time to repair; review monthly with supplier and engineering.
Quick action items (numbered):
- Define 3 KPIs before you request quotes.
- Require data output and a 48-hour support SLA.
- Run a 30-day field trial with sample inspections.
If you follow those steps, you’ll buy the right machine, prove your design, and avoid surprises.
How Robotic Riveting Systems Work and Where They Fit
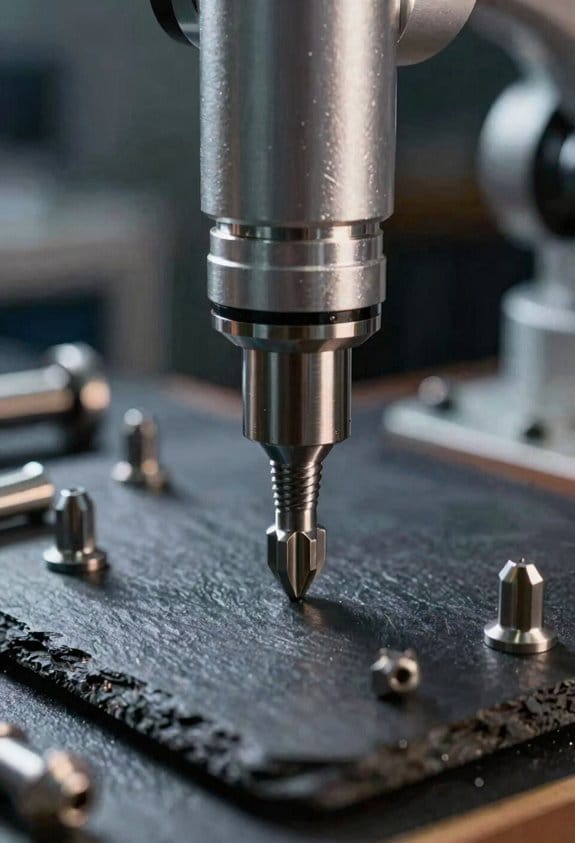
Here’s what actually happens when you automate riveting on a production line: it lets you cut cycle time, reduce rework, and keep people away from noisy, repetitive tasks.
Why this matters: automated riveting keeps quality consistent and reduces operator fatigue and injuries.
How the system is built and what each part does
1) Robot arm and kinematics
- The robot moves the rivet to the hole by controlling joints and tool paths so the rivet hits at the correct angle and speed; typically you program approach speeds of 50–300 mm/s and dwell times of 0.1–0.5 seconds depending on material.
- Example: on an aircraft wing panel you program the arm to follow the skin contour using a 6-axis robot with joint limits set to avoid the rib stiffeners.
2) Riveting head and end effector
- The end effector holds and activates the riveting head; quick-change mounts let you swap heads in 5–10 minutes for different rivet diameters (e.g., 3.2 mm vs 4.0 mm).
- Example: a production shop uses a pneumatic bucking head for solid rivets and swaps it to a blind rivet gun for interior access spots.
3) Rivet feeder and tooling
- Feeders deliver rivets at a controlled rate and orient them; set the feeder to feed every 1–2 seconds for medium-volume lines or 0.5–1 second for high-volume runs.
- Example: a feeder bowl vibrates parts into a chute and you calibrate it so misfeeds are below 0.5% per 10,000 rivets.
4) Sensors: vision and force
- Vision systems align the rivet to the hole using fiducials or hole-center detection, and force/torque sensors confirm the squeeze profile; look for squeeze force curves that match a golden sample within ±5%.
- Example: during automotive door assembly a camera finds the hole within ±0.2 mm and the force sensor reports a peak compressive load matching spec.
5) Programmable cells and safety
- Cells are programmed with the full fastening cycle: approach, align, set, squeeze, retract, and inspect; add light curtains and E-stops and program interlocks so the robot only moves when guards are closed.
- Example: a cell handling tight-tolerance avionics panels runs at 30–60 rivets per minute with a guarded perimeter and two-step operator enabling.
Step-by-step you’d set one up
- Define rivet type, hole tolerance, and cycle time target.
- Choose robot and riveting head sized for the torque and stroke you need.
- Integrate a rivet feeder and position sensors (camera + force sensor).
- Program motion paths and squeeze profiles; test with a sample part.
- Validate by running 1,000 rivets and checking defect rate and force curves.
Where robotic riveting fits in production
- Use it for high-volume lines where you need consistent cycle times, for assemblies with tight tolerances where repeatability under ±0.2 mm matters, or for hazardous processes you don’t want operators doing.
- Example: an aerospace shop automates fuselage skin riveting across 500 panels per week to keep defect rates below 0.1% and save 20 labor-hours per panel.
One last concrete note: expect initial setup and cycle tuning to take days to weeks, not minutes, and budget time for validating force signatures and vision markers before you ramp to full production.
Choosing Riveting Tech: Materials, Throughput & Force Needs
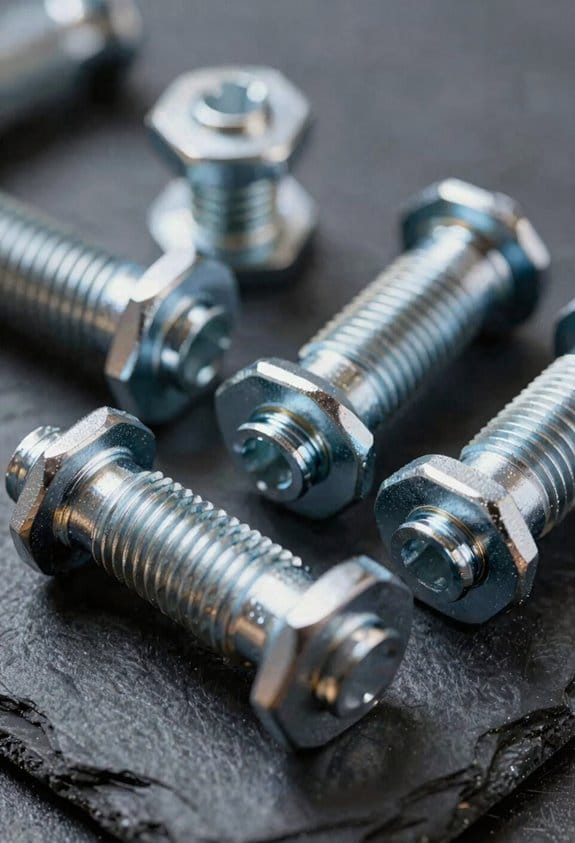
Before you pick a riveting method, you need to know the three things that decide which tech will work for your job: the materials you’re joining, the throughput you want, and the forming force needed.
Here’s what actually happens when you pick incompatible materials: corrosion or a joint that fails early. You should check galvanic compatibility and fastener coatings first. Example: when joining 2026-T3 aluminum to stainless steel in an outdoor bracket, use a nylon washer and an aluminum-compatible coating to prevent pitting within 2 years.
Why throughput matters: faster lines require different gear and choices affect per-part cost. If you need 600 parts per hour, choose a multi-head orbital riveter or a high-speed servo riveting cell; a manual gun only handles about 60–120 parts per hour and will bottleneck production. Example: a mid-size HVAC panel line upgraded from single-head pneumatic to a two-head orbital system increased output from 100 to 620 panels per shift.
Before you evaluate force needs, you should understand why force drives machine choice and fixture design. Measure or estimate the peak forming force for your rivet and material stack — typical blind rivet forming forces range from 1.5 kN for thin aluminum to 15 kN for thicker steel stacks. Example: assembling a 3 mm steel panel to a 2 mm steel backing required a 12 kN hydraulic press and reinforced fixture plates to avoid buckling.
How to choose, step-by-step:
- Identify materials and coatings.
- Calculate required forming force (use rivet datasheets or pull tests).
- Set your throughput target in parts/hour.
- Match technology: manual or single-head robot for ≤120 pph, orbital/multi-head for 200–1,000 pph, servo or hydraulic presses for >1,000 pph or high-force needs.
- Design tooling and corrosion prevention based on step 1.
A quick checklist you can use on the shop floor:
- Material pair and thicknesses.
- Required forming force (kN).
- Target parts per hour.
- Selected rivet type and coating.
- Machine class (manual, pneumatic, orbital, servo, hydraulic).
If you match materials, throughput, and force correctly, you’ll cut rework and downtime by avoiding underpowered machines, wrong coatings, or fixture failures.
Recommended Products



Quantifying ROI: Speed, Quality, and Cost Drivers
If you’ve ever wondered whether that riveting upgrade will actually pay off, this tells you how to test it quickly and clearly.
Why this matters: you’ll know how fast you’ll recoup the equipment and tooling costs. Start by measuring three drivers: speed, quality, and direct costs.
How to measure speed (one sentence why): faster cycles mean more parts per shift, which lowers labor per rivet.
Example: time ten rivets and average the cycle; if you cut cycle time from 8 seconds to 6 seconds, throughput rises by 33% for the same operator.
Steps:
- Measure cycle time per rivet over a full shift.
- Remove outliers (machine warmups, breaks).
- Calculate average seconds per rivet and parts per hour.
If cycle time drops 2 seconds, you save about 0.56 labor hours per 1,000 rivets.
How to measure quality (one sentence why): fewer defects cut rework hours and reduce warranty exposure.
Example: on a vehicle assembly line, reducing rivet defects from 1.5% to 0.5% saved two operators 4 hours a week in rework.
Steps:
- Track defect rate as defects per 1,000 rivets.
- Log rework hours tied to those defects.
- Convert rework hours to labor dollars using your shop rate.
If defect rate falls by 1% and your labor is $30/hr, you save $300 per 10,000 rivets in rework.
How to account direct costs (one sentence why): knowing monthly cash outflows gives you the real payback timeline.
Example: a small fab shop bought a pneumatic riveter for $9,000, $1,200/yr in maintenance, and $0.02/ rivet in consumables.
Steps:
- List equipment, tooling, consumables, and annual maintenance.
- Convert capital to monthly expense (e.g., 60‑month depreciation).
- Add monthly consumable spend based on expected rivet count.
In that example the monthly charge for capital is $150 plus maintenance of $100 and consumables that depend on parts run.
Building the ROI model (one sentence why): combining speed, quality, and costs shows payback and risk from uptime or scrap swings.
Example: using the shop numbers above, assume 20,000 rivets/month, a cycle improvement saving 200 labor hours/month, and defect reduction saving $120/month.
Steps:
- Compute monthly labor savings from speed (hours saved × labor rate).
- Add monthly savings from reduced rework.
- Subtract monthly equipment, tooling, and consumable costs.
- Project monthly cash flow and calculate months to payback.
- Run sensitivity: change uptime by ±5%, scrap rate by ±1%, and labor rate by ±10% to see payback range.
If your combined monthly net saving is $1,200 and total project cost was $9,000, payback is 7.5 months; if uptime drops 5%, payback might slip to 9 months.
Quick checklist to run this in a day:
- Time 100 rivets for cycle baseline.
- Pull defect and rework hours for the last month.
- Tally equipment, tooling, consumable, and maintenance costs.
- Build the simple spreadsheet with the five steps above.
- Run three sensitivity scenarios: optimistic, baseline, conservative.
Do this once and you’ll have a defensible payback window.
Recommended Products

Includes 8 mandrels/nosepieces in the following sizes: M4, M5, M6, M8, M10, 1/4", 5/16", 3/8"

4 Size Self-locking Gun Head Set:The nutsert gun comes with 4 sizes(10-24&1/4&5/16 &3/8). And equipped with 5 pcs mandrel replacement for each size. The head has a self-locking function that allows you to quickly assemble and disassemble the mandrels without tools, improving work efficiency, convenience and fast

Professional Rivet Tool: The pneumatic rivet nut gun is equipped with an alloy steel rotor, ensuring stable operation, high precision, and excellent wear resistance. A bottom-mounted adjustable knob controls airflow. Its efficiency far surpasses that of manual tools
Integrating Sensors, Vision & Industry 4.0 Data
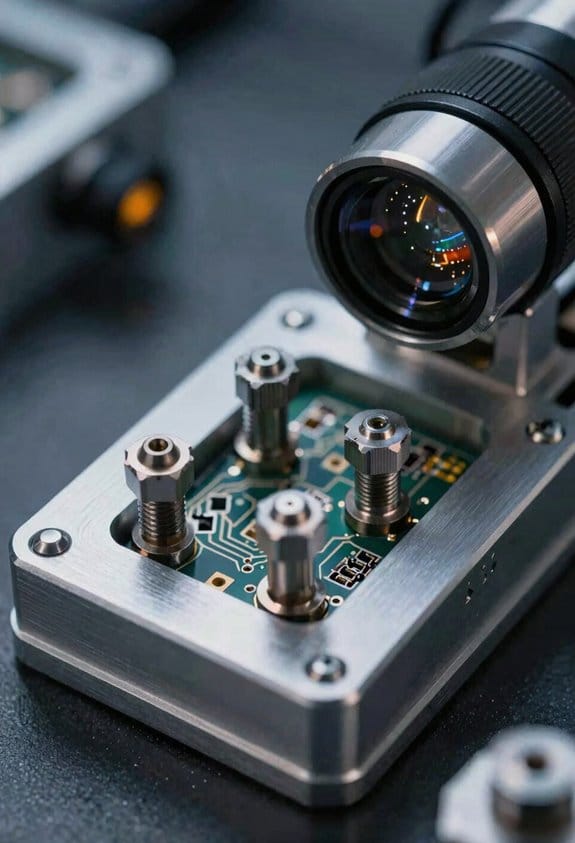
Think of sensor fusion like giving your rivet cell a set of senses it can trust.
Why it matters: you want consistent rivet quality even when parts vary. I use sensor fusion to combine force, position, and vision inputs so the rivet installer adapts to part variation in real time. For example, on an aluminum aircraft skin assembly, the vision system spot-locates a fastener hole to within 0.1 mm, the position encoder confirms tool approach, and a 500 N load cell verifies the upset; together they reduce rework by measurable amounts.
Before adding sensors, plan for data standards and latency limits.
Why it matters: otherwise data won’t line up and you’ll get false alarms. Start by choosing an industrial protocol (EtherCAT or Profinet) and set your loop latency target to under 50 ms for closed-loop control. Example: on a production line running 30 rivets per minute, keeping cycle-to-cycle variance below 5% requires latencies under that 50 ms threshold.
Here’s what actually happens when you add vision to locating fasteners.
Why it matters: visual errors create stoppages and scrap. Use a 5–12 MP industrial camera with a 16–35 mm lens mounted 300–500 mm above the part for typical panel work; light the area with 2–5 kLux LED ring lights to reduce shadows. A concrete example: a composite panel with recessed countersinks—apply a contrast filter and the vision algorithm finds the center within 0.2 mm, which prevents misfeeds and double-feeding.
If you’ve ever worried about verifying rivet set, here’s the practical approach.
Why it matters: torque or load alone won’t prove a good set. Install a torque transducer and a compressive load cell at the toolhead, sample at 1 kHz, and implement a simple pass/fail window like torque 8–12 Nm and peak load 400–600 N depending on rivet size. On one automotive closure panel line, adding this combo caught 0.7% hidden defects that visual checks missed.
The difference between raw factory data and actionable Industry 4.0 streams comes down to structure.
Why it matters: dashboards need clean inputs, not noise. Stream PLC and sensor outputs to an OPC UA server, tag data with timestamps synced via NTP or PTP, and group related metrics into batches of 10–30 seconds for trend analysis. For instance, feeding 1-minute aggregated torque averages into your dashboard makes wear trends visible — you might see torque drift 3% over a 12-hour shift and schedule a tool recalibration.
You don’t need expensive models to start predictive maintenance if you use simple rules first.
Why it matters: simple alerts catch many failures before they escalate. Implement rules like three consecutive rivet torque drops of >4% triggers a stop-and-inspect, or vibration RMS exceeding baseline by 20% over 60 seconds flags bearing wear. On a factory floor, this stopped a spindle failure before it damaged parts and saved one week of downtime.
Before you run a digital twin, mirror only what matters for the test.
Why it matters: simulation speed beats unrealistic detail. Model kinematics, sensor delays, and control loops first; skip micro-level thermal effects unless they’re causing issues. Example: simulate 1,000 rivet cycles with ±0.5 mm part variation and 40 ms communication jitter to validate control logic — this revealed an edge case where the installer retried and doubled cycle time.
Practical checklist to get reliable results (numbered steps):
- Pick communication: EtherCAT or Profinet and enforce sub-50 ms loop latency.
- Standardize timestamps: use NTP or PTP across devices.
- Select sensors: 5–12 MP camera, 500 N load cell, 1 kHz torque transducer.
- Set sampling: vision at 30–60 fps, force/torque at 500–1,000 Hz.
- Implement fusion rules: position + vision match within 0.2 mm, force window checks.
- Create alerts: three consecutive failures or 20% drift over 60 minutes.
- Feed dashboard: aggregate to 30–60 second buckets for trends.
- Simulate: run a digital twin for 1,000 cycles with realistic jitter.
- Document diagnostics: error codes, timestamps, and a recovery step for each code.
One clear diagnostic example: log entry with fields [timestamp, rivet_id, pos_error_mm, peak_load_N, torque_Nm, camera_match_score]. This single line format makes root cause analysis fast and repeatable.
Recommended Products

CS Mount 2.8-12mm Varifocal Lens: 1080P webcam with standard CS mount lens that can be changed. Manually adjustable focus and focal length for more applications,perfect for close-ups shooting

Ultra High Definition 8000x6000 Lightburn Camera for Laser Engraver, USB2.0 Machine Vision Industrial Camera for Computer,Raspberry Pi

1) Camera transfer speed is fast.
Avoiding Downtime: Common Implementation Challenges and Fixes
Here’s what actually happens when machines unexpectedly stop: you lose hours of production and scramble to find the cause.
Why this matters: downtime costs you real money and disrupts schedules. Start with a baseline inspection so you know what “normal” looks like. Example: walk a press line at shift start, record belt tension at 2 mm deviation tolerance, note any loose guards. Do this daily for one week to build your baseline.
Why electrical faults matter: a single short can halt a whole line immediately. Check for loose terminals, burned connectors, and tripped ground faults because those are the usual suspects. Example: on one assembly cell, a loose M12 connector caused intermittent stops every 90 minutes until they tightened it and replaced the cable; interruptions stopped. How to fix it:
- Inspect power terminations monthly.
- Use torque wrenches and tighten to spec (e.g., 2.5 Nm on PLC terminals).
- Label and photograph connectors after service.
- Keep one spare cable and one spare fuse per panel.
Worn tooling wears your throughput down; that slows production long before a failure. Why this matters: worn cutters and molds reduce yield and cause jams. Example: a packaging line with dull knives produced 8% more rejects until they replaced blades every 2,000 cycles. How to fix it:
- Log run-hours per tool.
- Replace cutting blades every 2,000 cycles or when torque rises 15%.
- Stock three spare blades per station for quick swaps.
- Implement quick-change fixtures so a change takes under 5 minutes.
Poor maintenance scheduling creates surprise downtime, not preventative uptime. Why this matters: calendar-based tasks miss usage spikes and wear patterns. Example: a company that switched from monthly oil changes to run-hour-based intervals cut unplanned stops by 40%. How to fix it:
- Tie preventive tasks to run-hours (e.g., every 500 run-hours).
- Use vibration thresholds: flag bearings when vibration exceeds 6 mm/s RMS.
- Audit maintenance logs monthly and adjust intervals based on failure trends.
Train operators to spot drift and jams because they’re your first line of defense. Why this matters: operators see machines every cycle and can catch subtle shifts. Example: an operator noticed feed misalignment and prevented a jam that would have taken an hour to clear. How to fix it:
- Teach three visual checks per shift: alignment, feed rate, and feed noise.
- Make training hands-on and measurable: pass a 5-minute practical test before solo operation.
- Retrain quarterly or after any crash.
Use remote diagnostics to reduce troubleshooting time since faster fault isolation cuts MTTR. Why this matters: you can identify the failing module before sending staff. Example: remote PLC logs pinpointed a faulty I/O board at 02:15, allowing the night tech to replace it on the first visit. How to fix it:
- Enable secure remote access for logs and fault codes.
- Configure alerts for specific fault codes and vibration spikes.
- Keep a documented remote checklist for on-call staff.
Finally, make repairs fast and predictable so you can get the line back quickly. Why this matters: quick repairs limit lost production. Example: a line with labeled spare parts and quick-change fixtures went from a 2-hour repair to 18 minutes on average. How to fix it:
- Standardize spare kits: include the top five replaceables for each cell.
- Use quick-change fixtures to cut swap time under 10 minutes.
- Measure Mean Time To Repair monthly and aim to reduce it by 20% within six months.
Audit maintenance data monthly and act on numbers because small trends become big failures. Why this matters: monthly checks keep your intervals realistic. Example: a monthly audit revealed that torque anomalies doubled after a supplier change, prompting a parts switch and restoring stability. How to fix it:
- Review failures, run-hours, and spare usage monthly.
- Adjust intervals and stock levels based on that audit.
- Publish one-page action items after each audit with assigned owners.
If you follow these concrete steps—baseline inspections, targeted fixes for electrical and tooling issues, run-hour-based maintenance, operator training, remote diagnostics, quick-change parts, and monthly audits—you’ll cut downtime and keep production predictable.
Future Trends: Orbital Riveting, Lightweight Materials & EV Assembly
Here’s what actually happens when you use orbital riveting on EV and lightweight structures: it forms a controlled, smooth head on the rivet while the surrounding thin aluminum or composite material flows instead of cracking, which matters because dissimilar materials fracture under sharp, uneven loads.
Orbital riveting basics — what it is and why you’d pick it
Why this matters: you need joints that don’t crack thin aluminum or composites when stressed.
Orbital riveting spins a tool that orbits the rivet shank, applying a smooth radial force so the material cold-forms around the rivet. A real-world example: on an EV battery cover made from 1.2 mm aluminum to a 2 mm composite panel, orbital riveting creates a leak-free, vibration-resistant joint without heat that would damage the composite resin.
How to start (3 steps):
- Pick rivet size and material — for 1–3 mm stacks, use a 4–5 mm blind rivet or solid rivet matched to the materials’ hardness.
- Set orbital force and orbit radius — begin with 6–8 kN peak force and a 0.5–1.0 mm orbit for thin aluminum.
- Run 50 sample pulls, check head profile and cracking under 10x magnification.
Key detail: measure final head height to ±0.1 mm.
How automation fits into EV assembly
Why this matters: automation speeds up production and keeps joint quality consistent.
Robots give repeatable motion, vision-guided placement, and quick-change tooling so you can switch rivet types between body panels and internal modules. Example: an automated cell that places 600 rivets per hour on a door inner panel using a 6-axis robot with vacuum pickers and a vision system reduced rework by 40% at an EV plant.
Practical setup steps:
- Integrate a vision system calibrated to 0.2 mm accuracy for rivet hole detection.
- Program robot paths with ±0.5 mm tolerance and test at 50% line speed first.
- Fit quick-change tooling that swaps in <10 minutes for different rivet diameters.
Maintenance note: log tool wear every 2,000 cycles.
Controlling force for aluminum and composites
Why this matters: different materials deform, so force control prevents cracking or underfill.
Aluminum work-hardens and flows; composites delaminate if you over-compress them. Example: joining a 1.5 mm aluminum skin to a 2 mm carbon panel required reducing peak force by 20% from the aluminum-only setting, and adding a 0.5 mm backing washer to spread loads and avoid resin squeeze-out.
How to implement force control:
- Use servo or force-controlled hydraulic units that feedback at 1,000 Hz.
- Program displacement limits and peak-force thresholds; start with 10% safety margin below failure loads.
- Log every rivet’s force/displacement curve for SPC and reject parts that deviate more than 3σ.
Testing, sensors, and maintenance — practical steps you can take
Why this matters: testing confirms designs and sensors catch problems before you scrap parts.
Example: a validation run where engineers added torque and displacement sensors reduced hidden joint failures from 2% to 0.2% by catching worn tooling early.
Steps to follow:
- Design and test three joint prototypes with varying rivet sizes and stackups; document pull-out and shear strength.
- Add torque, force, and displacement sensors to the riveting head, sampling at 500–1,000 Hz.
- Create a maintenance schedule: inspect tooling every 2,000–5,000 cycles, replace mandrels at 10,000 cycles, and keep a 48-hour parts buffer for unscheduled downtime.
Concrete metric: aim for <0.5% rivet rejection on the line.
Final practical checklist you can use tomorrow
Why this matters: a checklist gets you from theory to action fast.
Example: a startup EV line used this checklist and hit production quality targets in 6 weeks.
Checklist (numbered):
- Select rivet type and size for your stackup.
- Set initial force: 6–8 kN for 1–3 mm aluminum stacks.
- Calibrate vision to 0.2 mm and robot paths to ±0.5 mm.
- Install force/displacement sensing at 500–1,000 Hz.
- Run 50–100 sample joints and inspect heads at 10x.
- Log data and set SPC limits at ±3σ.
- Schedule tooling inspection every 2,000 cycles and mandrel replacement at 10,000 cycles.
If you follow these steps, you’ll reduce joint failures and ramp EV rivet production faster.
Frequently Asked Questions
How Do Rivet Inventory Logistics Change With Automated Systems?
They streamline my inventory: kanban integration triggers timely replenishment, batch forecasting refines order sizes, and automated feeders reduce on‑line stock, cutting waste and shortages while demanding tighter data discipline and supplier responsiveness.
Can Automation Handle Custom or Low-Volume Rivet Types?
Absolutely — I can, and I’ll shout it from the rooftops: I adapt to Custom materials and use Adaptive tooling, so I’ll handle bespoke, low-volume rivet types efficiently, though setups take longer and per-piece cost stays higher.
What Certifications or Standards Apply to Automated Riveting Equipment?
CE standardization and IPC compliance both apply; I’ll guarantee machines meet CE machinery directives, EMC and safety rules, plus IPC standards for fastening and assembly processes, and I’ll validate traceability, testing, and documentation accordingly.
How Do Warranties and Service Contracts Typically Differ for Robotic Riveting?
I typically see warranty duration shorter for robots (12–24 months) while service contracts extend coverage; service scope in contracts includes preventive maintenance, spare parts, software updates, and remote support, with on-site response priced separately.
What Training Is Required for Maintenance Staff on Automated Riveting Cells?
Like tuning a piano, I’ll need training in robot diagnostics, preventive maintenance, PLC troubleshooting, and safety protocols, plus hands-on robotics, vision-system calibration, quick-change tooling, and predictive-maintenance analytics to keep automated riveting cells reliable.