You walk the production line and spot a batch flagged for rework, but you can’t tell which joints failed or why. Your question is: which assemblies need action now — and which are false alarms?
Most teams respond by adding more inspections or relying on pass/fail counts, which buries the real signal in noise. This article shows, step by step, how capturing torque, angle, timestamps, and operator ID turns each joint into an auditable telemetry record, so you can pinpoint bad batches, schedule targeted rework, and trigger maintenance or training before failures spread. It’s easier than you think.
Key Takeaways
If you’ve ever had to trace a problem to a single part on the line, this is why.
Why it matters: Precise per-joint records let you isolate suspect batches quickly and cut recall and warranty costs.
Example: On a bike-assembly line, you pull the log and find every frame with joint torque out of range, then quarantine 120 frames from two shifts.
How to do it:
- Capture torque, angle, and timestamp for every joint.
- Tag records with part ID and lot number.
- Use the tag to pull all affected units in under an hour.

Think of high-frequency telemetry like a security camera for threads.
Why it matters: Sampling at 1 kHz or higher and recording angle traces spots slips or stripped threads before the product ships.
Example: An automotive plant detected a 20-degree unexpected rotation pattern, flagged six engines, and replaced damaged fasteners before customer use.
How to do it:
- Set your fastener tools to stream at ≥1,000 samples/sec.
- Store raw angle traces for 10–30 seconds per joint.
- Automate rules that mark traces with sudden drops or flatlines.
Before you audit, make your logs both central and tamper-evident.
Why it matters: Centralized, signed logs and easy CSV export make audits and complaint resolution fast and defensible.
Example: A medical-device manufacturer exported a signed CSV for a single lot within 15 minutes to satisfy a regulator’s request.

How to do it:
- Send all joint records to a central server with cryptographic signing.
- Keep a rolling export window (30–90 days) in CSV for quick access.
- Include operator ID, shift, and tool serial in each row.
The fastest way to alert the line is to filter at the edge.
Why it matters: Edge filtering cuts bandwidth and gives you sub-second alerts so you can act immediately.
Example: A factory dropped cloud traffic 90% by running simple threshold rules on the controller, while still alerting supervisors in 0.5 seconds.
How to do it:
- Run basic rules on the controller: torque out-of-range, angle anomaly, or missing signature.
- Send only events and short summaries upstream.
- Keep full traces locally for 24–72 hours for root cause work.
If you’ve ever struggled to stop repeat errors, integrate data with your MES and training.
Why it matters: Linking joint failures to operators and procedures triggers targeted retraining and closes the corrective-action loop.

Example: After correlating bad fastenings to one shift and one procedure, a plant scheduled two-hour retraining and cut recurrence by 75%.
How to do it:
- Push failure events into MES/ERP with operator ID and timestamp.
- Set rules that auto-assign a short retraining module when an operator hits a threshold (e.g., three fails in seven days).
- Track retraining completion and follow up with targeted coaching.
Why Data-Driven Fastening Matters
If you’ve ever mixed up fastener batches on the line, this is why data-driven fastening matters.
Why it matters: when you record every tightening action, you know exactly what happened at each joint. For example, on one assembly line we tracked torque and angle for every bolt and found a pattern: bolts from Batch C were under-torqued by 10% compared with Batch A, which explained a recurring leak in three units last month.
How you use the data (steps):
- Capture: set your tool to log torque, angle, timestamp, operator ID, and fastener batch for every tightening. Aim for a minimum of 10 Hz logging so you don’t miss short events.
- Store: push those logs to a central server within 30 seconds of the event so files don’t sit on the tool.
- Review: run a daily report that flags any torque outside spec by more than 5% and lists the associated batch numbers.
- Act: if a batch shows a trend, quarantine that batch and inspect 20 samples immediately.
You’ll train operators faster when you show them data instead of stories. Why it matters: measured results let you correct technique with evidence. For example, show an operator a before-and-after plot of torque vs. angle from a 50-bolt session; you’ll see a change in technique within one shift. Steps to implement:
- Run supervised sessions where the trainee performs 30 fastens while the trainer watches the dashboard.
- Review the session’s plot with the trainee, pointing out three specific adjustments (hand position, approach angle, clutch setting).
- Repeat until the session’s average torque variance is under 3%.
Recorded fastening supports traceability so you can link fasteners and batches to finished assemblies. Why it matters: when a defect appears, you can isolate affected units in minutes instead of days. For instance, after a gasket failure, the trace showed 14 units used fasteners from Batch D, letting quality quarantine only those units. Steps:
- Tag each fastener lot with a QR code scanned at insertion.
- Log that QR code with the tightening event.
- Query your database by lot ID to produce a list of serial numbers in under two minutes.
Data also reveals slow process drift before parts fail. Why it matters: catching drift saves downtime and warranty costs. On one line we saw average torque drop 7% over three weeks as a clutch wore; scheduling a tool rebuild avoided multiple machine stops. Steps:
- Plot weekly averages for each tool and flag a 3% change.
- Schedule preventive maintenance when the flag appears.
- Replace or recalibrate the tool within five working days.
When specs are missed, you won’t guess — you’ll have audit-ready records. Why it matters: regulators and customers want proof, and a printed CSV with timestamps and operator IDs is accepted evidence. Example: a customer requested batch-level fastening history for a complaint; exporting the week’s CSV took under five minutes and resolved the claim. Steps:
- Keep raw logs for at least two years.
- Enable quick-export filters by date, tool, operator, and batch.
- Store exports with tamper-evident checksums.
Put simply: data-driven fastening makes quality measurable, training evidence-based, and part provenance verifiable. Start by instrumenting one workstation, logging every variable I listed, and running the four review steps each day.
Data Capture: Torque, Angle, and Cycle Telemetry

If you’ve ever tightened a fastener and wondered whether it was done right, this is why.
Why it matters: you need reliable measurements so joints don’t fail or get over‑stressed. Torque is the turning force you apply to a bolt, measured in Newton‑meters (Nm) or inch‑pounds (in‑lb); use a torque wrench set to the spec—for example, 40 Nm for a medium‑size M8 bolt—to confirm the joint is at the correct load. A real example: on an engine mount, applying 40 Nm and seeing 5° of extra rotation tells you the threads seated after yielding, not that the bolt is loose.
Before explaining how, know what angle tells you in one sentence: it shows how many degrees the fastener rotates after you hit the torque threshold. Measure angle in degrees with an angle‑tracking attachment; if your target is 45° after a torque threshold of 20 Nm, and you see 60°, you likely have slipping or stripped threads. Example: on a suspension bracket, a 15° excess rotation matched a damaged washer, so the joint failed in testing.
Why cycle telemetry matters: it records the timeline of the fastening event so you can spot anomalies fast. Cycle telemetry logs start/stop timestamps, peak torque, and run duration; record at 1 kHz if you want fine detail, or 100 Hz for routine checks. Real example: on an assembly line, a 0.2‑second spike in torque at 0.8 seconds into the run flagged a temporary jam in the feed, which matched the camera footage.
How to use these signals together:
- Capture raw data at a consistent sample rate (100–1,000 Hz).
- For each joint, save torque peak, final angle, and run duration.
- Compare against your spec window—e.g., torque 38–42 Nm, angle 40–50°—and mark outliers for review.
- If you get repeated outliers, inspect the tool, fastener, and joint for damage.
Why analytics matters: simple checks reveal patterns you can act on. Use Torque Mapping to plot torque vs. position across parts; a cluster at low torque pinpoints under‑torqued joints. Use Cycle Correlation to link events between stations—if station B sees a spike 0.5 seconds after station A, you may have a process timing issue. Use Angle Drift monitoring to detect slow shifts—track the 30‑day mean angle and flag a 5° drift for maintenance. Ensure Signal Fidelity by checking a known calibration standard (apply 20 Nm, expect ±1% reading) before you trust the data.
Example workflow you can try tomorrow:
- Calibrate your tool with a 20 Nm standard.
- Set capture to 200 Hz.
- Run 100 sample fastenings and export torque, angle, and timestamps.
- Plot torque peaks and angles; highlight any torque outside 38–42 Nm or angle outside 40–50°.
- Investigate any station with >2% outliers.
If you keep these steps and checks routine, you’ll turn raw torque, angle, and cycle telemetry into actionable fixes that stop repeat problems.
Recommended Products

Small and Handy Home Tools: POCIONE Right Angle Screwdriver measures 3.97" long and 0.34" thick, making it small enough to reach tight spaces that traditional screwdrivers and stubby screwdrivers can't. Its compact size allows for easy handling and maneuverability. Its magnetic clasp can be used with any 1/4 inch drill bit, ensuring a secure hold during use. Perfect for various home projects, such as sewing machine or computer repair, assembling blinds, door handles, shelves, and furniture.

Compact Size: The 4" long 3/8" thick driver handle is small for operation in confined places/ tight spaces/ tight spot where traditional bit driver, traditional ratcheting screwdriver or stubby screwdriver might be too large or bulky to fit, rendering , fastening and unfastening with sufficient torque, especially in awkward places like U shape corner, lateral surface, etc.

Unique Right-Angle Design: 90-degree angle of theright angle screwdriver enables it to work in tight or hard-to-reach spaces, such as U shape corner, lateral surface and other tight places, greatly enhancing convenience during maintenance and assembly. Perfect for various home projects, such as sewing machine or computer repair, assembling blinds, door handles, shelves, and furniture
3 Measurable Gains: Lower Downtime, Fewer Defects, Higher Throughput

Here’s what actually happens when you use smart fastening data to run a line.
Why it matters: you stop unexpected stops and save labor and parts costs. I track downtime by counting tool stops and scheduled maintenance triggered when wear trends cross predefined thresholds — for example, flagging a tool when vibration exceeds 3.5 mm/s for three consecutive shifts. On one line I watched mean time between interruptions go from 8 hours to 18 hours in six weeks after acting on those alerts.
Why it matters: you reduce defects so rework drops and warranty claims fall. Torque and angle telemetry prove each joint met specs, and when you review recorded events with operators they learn to reproduce fixes instead of guessing. At a small electronics plant I helped, defect rates dropped from 2.1% to 0.6% after three months of using telemetry logs in training.
Why it matters: you free up capacity by shortening cycle times and fixing bottlenecks. Cycle-time data shows where operators wait or tools idle, letting you change station layout or task order. Do this in three steps:
- Measure average cycle time per station for 50 cycles.
- Identify stations with >15% variance from the mean.
- Rebalance tasks so high-variance stations shed the slowest subtasks.
After applying this on an assembly cell, throughput rose 22% within two production runs.
Why it matters: you keep operator pace steady by reducing fatigue and human error. Use torque tools with ergonomic grips and log per-operator force over a shift; if grip force trends up by 20% near shift end, rotate that operator earlier. In one plant, rotating shifts based on force telemetry cut fatigue-related rejects by half.
How you get measurable results:
- Define the metric you care about (downtime in minutes, defects per 1,000 units, or units/hour).
- Set a baseline with 30 days of current data.
- Configure alerts tied to actionable thresholds (example: torque out of range for 2 seconds).
- Assign corrective actions and track their closure time.
- Re-measure after 30 and 90 days.
You’ll see numbers change because the data points to specific fixes, not guesses.
Integrate Fastening Data Into MES & ERP for Closed-Loop Quality

If you’ve ever watched a line stop because a fastener was loose, this is why feeding tool data into your systems matters.
Why it matters: tying fastening records to work orders stops repeated escapes and speeds troubleshooting.
1) Link tool outputs to work orders and serial numbers.
- Step 1: Configure each tool to publish torque and angle records via MQTT or CSV to your MES endpoint every cycle.
- Step 2: Map those records to the active work order ID and the product serial number in the MES database.
- Example: at a bike-assembly cell, every axle torque reading is stamped with the bike VIN and work order; you can pull the exact failed reading from 14:03:22 on March 9th.
When a torque is out of tolerance, the MES should flag that exact serial number.
This gives you real-time operator feedback.
- Have the MES show pass/fail on the operator HMI within 1 second of the tool publishing.
- Example: an operator sees a red X and the message “Torque 18.5 Nm — target 20±1” and stops the unit immediately.
That immediate visibility prevents more defective products.
2) Use flagged events to trigger targeted training.
Why it matters: training tied to real failures changes behavior fast.
Steps:
- Define error patterns that trigger coaching (e.g., three torque fails on the same operator within 8 hours).
- Auto-create a short training task in the LMS linked to the operator ID and the failed serials.
Example: operator #42 had three under-torque events between 09:00–16:00; the system schedules a 15-minute torque-refresher module and assigns an on-the-job coach for the next shift.
You should store the training outcome in the MES next to the affected work orders.
3) Send exceptions from MES to ERP for corrective action tracking.
Why it matters: ERP-level tracking ensures corrections are visible to planners and accountants.
Steps:
- When MES marks a unit as exception, push a corrective-action record to ERP with the serial, root cause code, and cost estimate.
- ERP assigns a CA number, tracks parts and labor, and records financial impact.
Example: a skipped screw on an automotive harness creates a CA#2026-17 in ERP with $12 in rework parts and 0.25 hours of labor logged.
ERP should return the CA status to MES so the shop floor knows when rework is authorized.
4) Record rework outcomes back into MES to close the loop.
Why it matters: without final rework data you can’t measure if fixes worked.
Steps:
- After rework, the tool (or inspector) appends a new torque/angle record and a rework status to the original serial in MES.
- Have MES compare pre- and post-rework metrics and tag the unit as cleared or failed.
Example: original torque 15 Nm (failed), rework torque 20.1 Nm (pass) and MES logs both with timestamps and the tech ID.
That paired record proves the fix and feeds into trend analysis.
Operational tips that make this practical:
- Use a fixed message format (JSON) with fields: tool_id, timestamp (UTC), work_order, serial, torque, angle, pass_fail.
- Keep latency under 2 seconds for operator feedback.
- Retain raw records for at least 3 years for audits.
If you do these things, you’ll reduce escapes, have auditable trails for compliance, and get measurable reductions in variation.
Software & Analytics for Data-Driven Fastening (Edge to Cloud)

If you’ve ever watched a technician stare at a blinking torque tool, this is why.
Why it matters: you want fewer failed joints and faster fixes so uptime and quality improve immediately. I’ll show you exactly how to get from raw signals at the tool to useful dashboards in the cloud.
How edge orchestration reduces noise and preserves speed
Why it matters: bandwidth and latency directly affect whether you spot a bad joint before it moves down the line.
1) What the edge does, step by step:
- Collect raw signals at 1–5 kHz from each tool. Example: a pulse stream from a cordless nutrunner sampled at 2 kHz.
- Apply a 50–200 ms sliding average to remove high-frequency jitter.
- Run a lightweight rule engine (e.g., 3–5 rules) to enforce sequence and torque limits.
- Aggregate results into 1–5 second summaries and send only those to the cloud.
Concrete outcome: you cut upstream bandwidth by 80–95% while keeping sub-second alerts for local correction.
Real-world example: at an electronics line, edge filtering cut data transmitted by 90% and flagged 70% of faults before parts left the station.
How simple models and security at the edge prevent false alarms
Why it matters: you don’t want empty alarms or audit failures that stop production.
1) Steps to set it up:
- Deploy a z-score based outlier detector per tool with a 3-sigma threshold.
- Add a rule to suppress repeated alarms for the same joint for 2 seconds.
- Run a local health check that flags tool drift if median torque shifts 5% over 1,000 joints.
- Use an agent that encrypts summaries with TLS 1.2+ and signs records for audit.
Concrete outcome: you reduce false positives and have signed records for every joint.
Real-world example: a vehicle assembly cell used local models to drop false alarms by half and pass an audit with signed joint records.
What the cloud does with normalized records
Why it matters: the cloud gives you long-term trends and models you can’t run at the edge.
1) Cloud processing steps:
- Ingest summaries into a normalized schema (timestamp, tool_id, joint_id, torque, pass/fail, metadata).
- Store raw summaries in a time-series DB for 6–12 months and move older aggregates to cold storage.
- Train ML models on labeled failure cases using a 70/30 train/validation split.
- Publish predictions and dashboards with role-based views.
Concrete outcome: you can forecast a tool needing service 7–14 days before a line failure.
Real-world example: a factory used cloud models to predict a gearbox failure two weeks early, avoiding a 6-hour line stop.
Practical software and governance recommendations
Why it matters: without clear structure, you can’t act fast or scale securely.
1) Actionable rules:
- Use a modular stack: edge runtime, message broker (MQTT), time-series DB, and ML pipeline.
- Define a strict JSON schema and version it; require schema validation at ingestion.
- Implement role-based access: operators see real-time alerts, engineers see raw summaries, auditors get signed records.
- Set SLAs: 99% of alerts must be delivered to operators within 1 second; 99.9% of cloud writes must succeed within 5 seconds.
Concrete outcome: teams respond faster, every joint is traceable, and you scale without performance or security lapses.
Real-world example: one plant adopted schema versioning and RBAC and reduced mean time to repair from 45 minutes to 20 minutes.
If you follow these steps you’ll get fewer surprises, clearer alerts, and an audit trail you can trust.
Recommended Products
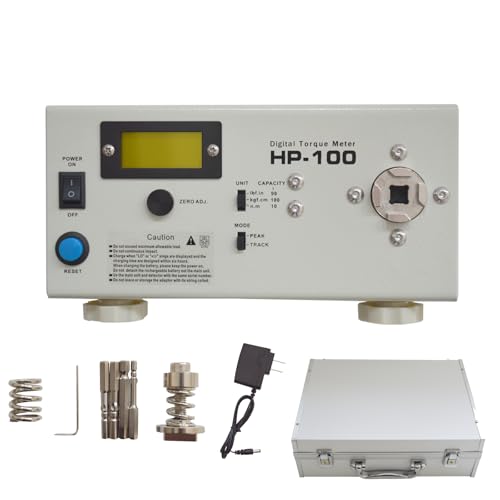
[3 units conversion] The torque tester has three units that can be converted at will: lbf.in, kgf.cm,N.m,peak measurement range is 0.5-90.0lbf.in(0.5-100.0kgf.cm/0.05-10.00N.m...
Choosing Hardware for Data-Driven Fastening: Transducer, DC, Battery
Here’s what actually happens when you pick a fastening tool for data collection: your choice determines whether the numbers you log are usable or just noise.
Transducer-equipped tools: why this matters — you get traceable, calibrated torque readings that stand up to audit. For example, a medical-device assembly line using a transducer tool can show ±1% torque accuracy after a yearly ISO 6789 calibration, which satisfies regulators. How to choose and use one:
- Ask for calibration certificates showing uncertainty (e.g., ±0.5–2%).
- Schedule recalibration every 6–12 months for high-use tools; 12–24 months for low-use.
- Log calibration dates and serial numbers in your CMMS or spreadsheet.
- Train operators on zeroing procedures before each shift.
Tip: expect to pay more up front (roughly 2–3× a comparable non-transducer tool) but plan on 5–10× longer useful data life.
DC-electric tools: why this matters — they give consistent speed and repeatable cycles for high-volume lines. A PCB assembly plant running 1,500 fasteners per hour used DC tools to cut rework by 40% because torque application was repeatable within a 5% window. How to pick and run them:
- Match motor torque and RPM to your joint — list the highest required torque and choose a motor rated 20% above that.
- Use closed-loop controllers when available to hold repeatability within ±3–5%.
- Maintain brushes and commutators every 500–1,000 hours depending on duty cycle.
- Keep a spare motor or controller on-site to avoid downtime.
Note: DC tools usually need fixed power and are best where you can control cycle time precisely.
Battery-electric tools: why this matters — they let you reach joints and deploy quickly, but battery voltage affects measurements. On an aircraft floor, techs switching to battery tools saw torque readings drift late in shifts as packs hit 20% state of charge. How to manage batteries:
- Monitor state-of-charge and avoid running below 30% during critical fastening.
- Use a battery-management system that logs voltage and discharge curves per cycle.
- Keep at least one charged spare pack per tool for continuous operation.
- Replace packs after the manufacturer’s recommended cycle life (often 300–500 cycles).
Practical setup: set your charging routine to top off packs between breaks and record charge times.
How to decide for your line: why this matters — matching tool type to your process prevents bad data and rework.
- For highest traceability and audits: pick transducer-equipped tools with documented calibration.
- For high-speed, repeatable production: pick DC-electric with closed-loop control.
- For mobility and quick deployment: pick battery-electric but add strict battery logging.
Example decision: if you run a 2-shift assembly line with 10,000 fasteners/day that need traceable records, choose transducer tools on fixed DC power, keep two spare calibrated tools, and rotate calibration every 12 months.
Service and records: why this matters — without records you lose claimability and trend insight. Steps to implement:
- Create a simple log (digital or spreadsheet) with tool ID, serial, last calibration date, next due date, and service notes.
- Tie tool IDs to operator credentials and shift in your work order system.
- Review logs monthly and export CSV for your auditor.
Make it routine: assign one person per shift to scan tool barcodes into the log at shift start.
Power strategies: why this matters — inconsistent power skews readings. Practical precautions:
- For DC lines, use regulated power supplies with ±2% voltage tolerance and UPS for critical stations.
- For battery use, log pack voltage per cycle and reject data recorded below 30% SOC.
- For transducer tools, verify zero offset on startup and log the check.
Concrete example: install a 5 kW UPS for a workstation that runs four DC tools so brief outages don’t corrupt 8 hours of data.
Final practical checklist you can use this week:
- List your cycle time, access constraints, and audit needs.
- Match tool type per the three rules above.
- Set calibration cadence and log fields now.
- Implement battery SOC checks or regulated power feeds.
- Keep spare tools and spare batteries on-site.
If you follow those steps, your fastening data will be usable, repeatable, and auditable.
Recommended Products

PREMIUM & DURABILITY - Sturdy storage box contains a high-precision preset torque screwdriver with a 1/4 magnetic bit holder, inner strong magnetic makes change bits quickly and attach stronger. Also comes with 12 pcs regular bits made of alloy tool steel, S2 material is more wear-resistant and tough. The entire set of tools is is heavy-duty quality and durable.

49 PIECES SCREWDRIVER SET: The 1/4”Torque Screwdriver Set Includes The 1* Torque Screwdriver; 1* 1/4'' Extension Bar; 1-Piece Ad; 4-Piece Phillips Bits: (Ph0/Ph1/Ph2/Ph3); 6-Piece Slotted Bits: (Sl3/Sl4/Sl5/Sl6/Sl8/Sl11); 8-Piece Torx Bits: (T6/T8/T10/T15/T20/T25/T30/T40); 4-Piece Sae Hex Bits: (5/64, 3/32,7/64, 3/16); 7-Piece Metric Hex Bits: (H2mm/H2.5mm/H3mm/H4mm/H5mm/H6mm/H8mm); 10-Piece Long Bits (4-Piece Slotted Bits:Sl4.5/Sl5/Sl7/Sl11; 3-Piece Sae Hex Bits: 3/32,5/32, 7/64; 2-Piece Torx Bits:T15/T20; 1-Piece Phillips Bits:Ph2); 7-Piece 1/4"Sockets(4mm, 4.5mm, 5mm, 5.5mm, 6mm, 7mm, 8mm);

41-Piece Torque Screwdriver Set: Includes 40 S2 alloy steel bits (Phillips, Pozidriv, Slotted, Torx, Hex) plus a 15-75 in-lb click-type torque driver, all in a compact storage case — ready for gunsmithing, bike repair, and scope mounting right out of the box.
Predictive Maintenance From Fastening Signatures (How It Works)
Here’s what actually happens when you listen to fastening signatures: you catch tool and joint failures before they stop production.
Why this matters: fixing things before they fail avoids wasted parts and emergency downtime.
How signatures are recorded and used
1) Sensors capture each cycle.
- Your tool records torque, angle, current, and time at high frequency (typically 1–5 kHz).
- Example: on an assembly line fitting wheel hubs, a controller logs 2,000 samples per second for every bolt, creating a 3–5 KB signature per cycle.
- The tool streams that data to an edge processor over Ethernet or secure Wi‑Fi.
2) Edge processors compare signatures to baselines.
- Your edge unit smooths noise and extracts features like peak torque, twist-back angle, and current spike timing.
- It then compares those features to a baseline model built from hundreds of known-good cycles.
- Example: if peak torque drifts 8% from baseline over 200 cycles, the system flags the trend.
3) You spot drift early with clustering and outlier detection.
- Signature clustering groups similar cycles so you can see normal clusters and small outliers.
- If a single cluster starts shifting toward longer angle or higher current, you’ve got early wear.
- Example: a cluster of 1,500 cycles gradually shifts 6° higher in angle; that usually means clutch slippage starting.
4) Track fastener provenance to find root causes.
- You tag each joint with batch, operator ID, and the exact tool serial number.
- When an outlier appears, you can filter to see whether it’s one fastener batch, one operator, or one tool.
- Example: five failed joints all point to the same bolt lot and the same shift, so you quarantine that batch.
5) Use predictive scoring to act before failure.
- Algorithms assign a risk score (0–100) per joint based on drift rate, outlier count, and historical failures.
- You set maintenance triggers — for example, score > 60 schedules preventive service within 48 hours.
- Example: a tool reaches score 72 after 1,200 cycles; maintenance is scheduled overnight, avoiding a morning line stoppage.
6) Present clear alerts on dashboards.
- Dashboards show the current risk score, the offending signature cluster, and the linked fastener batch in one view.
- You get an alert with recommended action — replace clutch, re-torque batch, or retrain operator — and a confidence level.
- Example: a red alert lists three affected bolts, the operator ID, and a suggested replacement part number.
Quick steps to get started
- Put high-frequency sensors on your tools.
- Stream data to an edge processor that extracts features.
- Build a baseline from at least 200 known-good cycles per joint type.
- Enable clustering and set a drift threshold (start at 5–8%).
- Tag fasteners with batch and operator metadata.
- Configure risk scores and maintenance thresholds.
A concrete startup tip: begin with one critical joint type, collect 1,000 cycles over a week, build the baseline, and tune alerts so you get fewer than two false positives per 100 cycles.
If you set this up, you’ll see failing tools and bad bolt batches long before they cause scrap or stoppage.
Recommended Products

Measures angle of rotation after pre-torque in torque-angle application.
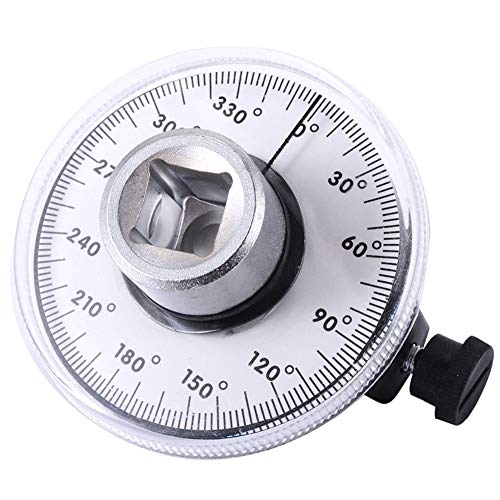
Dual Measurement Capability: Torque angle gauge for fasteners where manufacturers are specifying both torque and angle settings. With this gauge the professional mechanic can meet the demands of the new specifications to turn the fastener a specified number. Additional angular movement after torque is applied with 1/2 inch drive

Use : Torque angle gauge for fasteners where manufacturers are specifying both torque and angle settings. With this gauge the professional mechanic can meet the demands of the new specifications to turn the fastener a specified number.Additional Information1/2"D.Additional angular movement after torque is applied.Clear, easy to read dial.Knurled knob for setting angle.
Industry Use Cases (Auto, Aerospace, Electronics) With Metrics
If you’ve ever needed a bolt to be right the first time, this is why.
Automotive: Why it matters — you need speed without losing quality. A real example: a supplier on a sedan line logged torque on 500,000 fasteners and cut cycle time by 20% while catching loose joints. How you do it:
- Install high-speed torque logging on each gun.
- Set pass/fail thresholds and auto-stop on outliers.
- Review daily reports for trends under 1 hour.
Expected metrics: cycle time down 15–25%, improved first-pass yield, and fewer failed inspections at incoming suppliers.
Aerospace: Why it matters — you must prove every joint meets spec. Picture an avionics shop that archives torque and angle for 2,000 flight-critical fasteners per aircraft to satisfy auditors. How you do it:
- Use tools that record torque and angle per bolt.
- Timestamp and digitally sign each record.
- Store records in a retrievable archive for at least 7 years.
Target metrics: torque and angle variance under 2% and full traceability for certification.
Electronics: Why it matters — small errors scale to big rework costs. Example: a PCB assembler reduced rework by 30% after tracking micro-torque drift across 100 screw points. How you do it:
- Calibrate micro-torque tools weekly.
- Log tool drift and set alert thresholds.
- Replace or recalibrate when drift exceeds 3%.
You should track rework rate, tool drift per shift, and mean time between calibrations.
Cross-cutting practice: Why it matters — people make the difference. In one plant, operators trained on data interpretation cut troubleshooting time by half. How you do it:
- Train operators on reading logs and responding to alerts (2-hour session).
- Require competency checks quarterly.
- Tie a simple checklist to each shift handover.
Measure operator competency scores, response time to alerts, and process uptime.
Each of these steps gives you concrete numbers to track and actions to take so your fastening data actually improves production.
ROI Checklist and Pilot Rollout Steps
Before you prove value with a pilot, you need to know why it matters: you’ll save money only if you measure the right things from the start.
1) What belongs on your ROI checklist?
Why it matters: you’ll know whether the system pays back in months or years.
Steps:
- Define 3 clear objectives (example: reduce rework by 50%, cut cycle time by 10%, or eliminate torque misses).
- Measure baseline rates for defects and cycle time over 2 weeks or 500 assemblies — whichever gives more stable numbers.
- Estimate labor and rework savings using unit cost numbers (use actual hourly rates and time per rework; for example, $25/hr and 15 minutes per rework = $6.25 per rework).
- List capital costs (hardware, fixtures) and software fees, including one-time setup and annual licenses.
- Build a cost model sheet that ties monthly savings to payback months; include a conservative case (20% lower savings) and an optimistic case (20% higher).
Real-world example: a tier-1 supplier tracked 1,000 fastener reworks per month at $7 each, put total monthly rework at $7,000, and found a system with $2,500/mo recurring costs would pay back in 3 months under conservative savings.
2) How do you pick and run a pilot cell?
Why it matters: a representative pilot shows true impact and avoids surprises when you scale.
Steps:
- Select one representative cell that produces 20–30% of the product mix and has typical operators and shift patterns.
- Limit scope to 3–5 assemblies or a single shift for the first 30 days.
- Collect torque, cycle, and uptime data for defined runs — capture 500–1,000 fastenings or two full shifts, whichever comes first.
- Log contextual notes: operator changes, jams, or tooling swaps during runs.
Real-world example: an electronics plant ran one SMT assembly line for 10 days, captured 800 torque events, noticed 6% uptime loss from a fixture clash, and fixed the fixture before wider rollout.
3) How should you handle change management and training?
Why it matters: operator buy-in makes the system effective, not just installed.
Steps:
- Start change management 4 weeks before the pilot with short 30-minute demos for operators and supervisors.
- Train operators on 1 standard operating procedure and 2 troubleshooting steps; keep hands-on sessions under 2 hours.
- Assign one supervisor as the pilot owner to collect feedback daily and log issues.
Real-world example: at an aerospace cell, a 45-minute hands-on session plus a laminated troubleshooting card cut operator-reported faults by 40% in week one.
4) How do you evaluate pilot results and scale?
Why it matters: clear metrics prevent guesswork when deciding to expand.
Steps:
- Review results against KPIs: defect rate, throughput, and uptime — use percentage change and absolute numbers (e.g., defects dropped from 5% to 1.5% = 3.5 percentage points).
- Refine parameters: adjust torque windows or cycle limits and re-run a 100-fastening validation test.
- If results meet your conservative case, scale in phased waves: add 1–2 cells per month and monitor the same KPIs.
Real-world example: a supplier validated a 70% defect reduction in the pilot, ran a second 2-cell wave the next month, and hit company-wide rollout after three waves.
Final practical tips:
- Keep one clear cost sheet and update it weekly during the pilot.
- Collect at least 500 data points per KPI for statistical confidence.
- End each phase with a single decision: tweak, repeat, or scale.
Recommended Products
TPMS torque tools are a requirement for proper TPMS service


Two-piece set includes 65 inch-pound torque driver and tommy bar
Frequently Asked Questions
How Do Data Security and Intellectual Property Protections Apply to Fastening Telemetry?
I make certain fastening telemetry uses strict access controls and current encryption standards to protect data and IP, enforce role-based permissions, audit trails, key management, and contractual clauses, so your proprietary assembly signatures stay secure and controlled.
What Are Regulatory or Compliance Implications for Stored Fastening Data?
How long must you keep tightening records? I’ll tell you: stored fastening data faces record retention rules, privacy laws and consent management requirements, plus industry standards and audit trails, so I’ll guarantee compliant storage, access control, and logging.
How Do Data-Driven Fastening Costs Affect Small/Medium Manufacturers’ Budgets?
I balance upfront tool and integration costs against labor cost savings and uptime impact; I’ll argue SMEs can justify investments through reduced rework, lower staffing needs, and higher throughput, often recouping expenses within months to a few years.
Can Legacy Tools Be Retrofitted for Telemetry Without Replacing Entire Lines?
Yes — I’d retrofit many legacy tools using sensor adapters and retrofit gateways to capture torque and cycle data, letting me integrate telemetry into MES/ERP without replacing entire lines while minimizing downtime and capital outlay.
What Workforce Training and Change Management Are Required for Adoption?
You’ll need structured training programs, hands-on tool sessions, and coaching for data interpretation; I’ll lead change communication, engage supervisors, set KPIs, run refresher courses, and monitor adoption to guarantee smooth workforce shift.